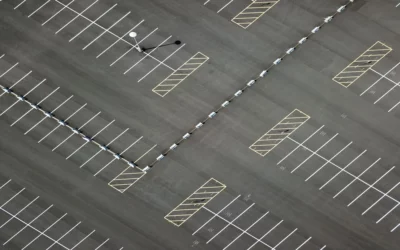
Parking Space Detection: Failure Modes to Test
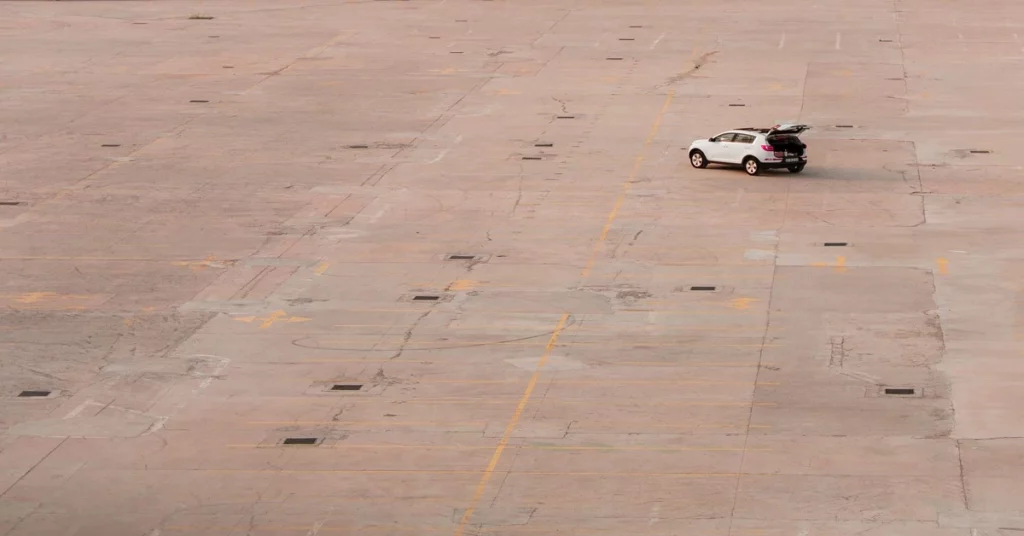
Real-world parking space detection is not defeated by tidy diagrams. It is defeated by February slush, a white delivery van covering half a bay, a low sun turning every painted line into a shadow, and a temporary event layout created with cones at 6 a.m. If you are evaluating a system in 2026, the useful question is not whether a demo works on a clear weekday afternoon. It is whether the vendor can prove performance under the specific conditions that make your outdoor parking lot or marina unreliable today.
This field guide is deliberately sceptical. It focuses on the situations that break naive systems and on practical tests you can run before signing a contract. Use it to move the discussion from marketing percentages to observed evidence on your own site.
Where parking space detection breaks in the field
Most failures fall into one of three categories: the bay cannot be seen clearly, the vehicle shape is ambiguous, or the layout no longer matches the model’s assumptions. Treat parking space detection as an environmental test, not only a software evaluation. A system that performs well on crisp asphalt markings may struggle on gravel overflow areas, grass parking, waterside lots, or seasonal layouts unless it has been trained and validated for those cases.
| condition | why naive detection fails | what to ask a vendor | how to test it on site |
|---|---|---|---|
| Snow cover and standing water | Snow hides bay markings and changes vehicle contrast. Puddles can reflect sky, lights, boats, poles, or vehicles, creating false edges and false occupancy signals. | Ask for examples from outdoor sites with snow, slush, rain, and reflective puddles. Ask whether the model uses bay geometry, object detection, temporal evidence, or a combination. | Test after snowfall, during thaw, and after heavy rain. Compare system output against a manual count at fixed intervals and note whether errors cluster in specific low-lying bays. |
| Low winter sun and long shadows | Strong shadows can resemble vehicles or divide a vehicle into misleading regions. Low sun also causes lens flare and reduces contrast on light-coloured vehicles. | Ask how the system handles seasonal sun angle and whether camera positions are reviewed for glare paths, not just coverage. | Run trials at sunrise, midday, and late afternoon in winter. Include bays near trees, poles, masts, fences, and signs that cast long shadows. |
| Night-time and headlight glare | Headlights saturate parts of the image. Wet asphalt amplifies glare, while dark vehicles may disappear into poorly lit backgrounds. | Ask for night accuracy separately from daytime accuracy. Ask whether the vendor has tested with moving headlights, parked vehicles with lights on, and wet surfaces. | Take ground-truth samples after dark, especially during peak arrival and departure. Include rainy nights, not only dry nights with uniform lighting. |
| Partial occlusion by vans, trailers, hedges, or equipment | A tall van can hide a small car in the next bay. Trailers, boat equipment, hedges, bins, and temporary signage may block the camera view. | Ask what percentage of each bay must remain visible and how the system reports uncertainty when a bay is partly hidden. | Park vans and trailers in realistic positions. Do not test only with compact cars. Check whether the system makes confident wrong calls or flags reduced confidence. |
| Motorcycles and oversized vehicles straddling bays | Small vehicles may be missed if the system expects car-sized objects. Oversized vehicles can occupy two bays, causing one true occupancy event to be counted incorrectly. | Ask how motorcycles, camper vans, vehicles with trailers, service vehicles, and cars straddling lines are represented in the data model. | Create test cases with motorcycles, long vehicles, and poor parking behaviour. Verify whether the output reflects usable spaces, not just objects detected. |
| Faded or absent line markings on gravel and grass overflow areas | Systems that depend too heavily on painted lines may fail when lines are faded, covered, or never existed. Gravel and grass introduce texture changes that can look like boundaries. | Ask whether virtual bay polygons can be defined independently of physical lines and whether they can be adjusted without repainting. | Include your worst overflow area in the pilot. Mark a ground-truth map of intended bays and compare results when vehicles are parked irregularly. |
| Camera mounting height and viewing angle | A low or shallow angle increases occlusion: one vehicle blocks another. Too wide a view can reduce vehicle detail. Too narrow a view may miss approach context. | Ask for a proposed camera plan with expected visible area, blind spots, pixel density, and examples of similar mounting heights. | Use temporary mounts or existing poles to trial the proposed perspective. Test with the lot at different occupancy levels, not just when it is nearly empty. |
| Seasonal foliage growth | Branches that are harmless in winter can cover bays in summer. Moving leaves can also create changing shadows and visual noise. | Ask whether the site survey accounts for seasonal growth and whether the vendor reviews camera views after leaf-out. | Inspect historic imagery if available, then run a summer validation. Identify bays that disappear behind hedges, trees, or marina landscaping. |
| Temporary layout changes during events | Cones, marshals, overflow fields, closed rows, and ad hoc VIP areas change the definition of “available”. A fixed model may continue counting spaces that are not in use. | Ask how temporary closures and event layouts are configured, who can update them, and how quickly the changes appear in reporting. | Simulate an event plan with closed bays and temporary rows. Verify that availability reflects the operational layout, not the normal painted layout. |
Ask for evidence under stated conditions
A single accuracy figure is not enough. It should come with the conditions under which it was measured: site type, camera height, weather, lighting, occupancy level, marking quality, vehicle mix, and the time period sampled. A claim based on sunny daytime images from a well-marked lot tells you little about a waterside facility with glare, trailers, and seasonal peaks.
Push for segmented results. Day versus night. Dry versus wet. Standard bays versus overflow areas. Normal operations versus events. If the vendor cannot separate those cases, you cannot know whether the impressive average hides the exact failures that matter to you.
How to read a parking space detection accuracy claim
Accuracy is often used loosely. In practical operations, two terms are more useful: precision and recall. Precision asks: when the system says a space is occupied, how often is it right? Low precision means false occupied calls, which can make a facility look fuller than it is. Recall asks: of all truly occupied spaces, how many did the system find? Low recall means missed vehicles, which can create unsafe or misleading availability counts.
The same logic applies to available spaces. A false available space is usually more damaging to the driver experience than a false occupied space, because it can send people toward bays they cannot actually use. For operators, the right balance depends on the use case: guidance signage, operational dashboards, enforcement support, berth-area monitoring, or demand analytics. The vendor should explain which errors are most common and how the system handles uncertainty.
A percentage without stated conditions is meaningless because the denominator is unknown. Was it measured over 200 images or 2 million bay observations? Were motorcycles included? Were event days excluded? Was snow present? Were partially occluded spaces removed from the test set? Were results calculated per image, per bay, per hour, or per occupancy change? Each choice can change the number.
Run a ground-truth spot check before procurement
A useful spot check does not need to be complicated, but it does need discipline. First, define the exact area being tested and list every bay or intended parking position, including gravel or grass overflow spaces if they are part of normal operations. Second, choose test windows that represent your difficult conditions: wet morning, low sun, evening arrivals, peak Saturday, event setup, and the quiet period after departures.
During each window, capture manual ground truth at the same timestamp as the system output. This can be done by trained staff walking the site, reviewing a recorded image, or using a marked site map. Record three states where possible: occupied, available, and uncertain or unusable. The third state matters because temporary closures, blocked bays, and ambiguous straddling should not be forced into a clean binary label without an operational decision.
Then compare bay by bay. Count false occupied, false available, missed multi-bay occupancy, and uncertainty handling. Look for patterns rather than only totals. Ten errors spread randomly across 2,000 observations may be manageable. Ten errors concentrated in the same entrance row, overflow area, or marina-side section may create persistent operational pain.
Finally, repeat the test after a layout adjustment or camera tuning. Good evaluation is iterative: the first result shows where the system struggles; the second shows whether the vendor can correct it. If performance improves only by excluding hard bays from the report, be cautious. Exclusions may be acceptable if clearly labelled, but they should not be hidden inside an accuracy claim.
What a credible vendor response sounds like
The strongest vendors do not pretend adverse conditions do not exist. They describe limitations, show comparable deployments, propose camera positions that reduce occlusion, and agree on acceptance tests using your site’s difficult cases. They should be comfortable discussing false positives, false negatives, confidence thresholds, and operational fallbacks when visibility is poor.
Be wary of answers that rely on generic screenshots, perfect weather demonstrations, or a single headline number. Also be wary of systems that require your outdoor site to behave like a drawing: permanent markings, standard vehicles, no shadows, no temporary changes, and no seasonal growth. Real facilities do not operate that way.
If you are still mapping out how the technology works before stress-testing it, our explainer on parking space occupancy detection covers what the system measures per space and the data it produces.
Once a system has passed your site tests, the other half of the decision is what it costs: our breakdown of parking occupancy detection cost works through the published price list per space and the budget items that sit outside it.
If the markings are not merely faded but absent altogether, the answer changes shape: see parking space detection on unmarked lots, where the system reports vehicle counts rather than the state of individual bays.
To hold ourselves to the standard set out above, here are the conditions behind our own number. Parkinto provides AI camera-based occupancy detection for outdoor parking lots and marinas, with no ground sensors. The 99.7% figure refers to free/occupied state per space in current operation, derived from a camera image captured and evaluated every 30 seconds, with the camera positioned so that the occupancy is visible to the naked eye from that viewpoint — one well-placed camera covers up to 100 spaces. An independent measurement by the Czech Technical University put an earlier version of the system at 99.4%. If you are evaluating parking space detection for a demanding location, ask us to test it against the conditions that actually affect your site.